
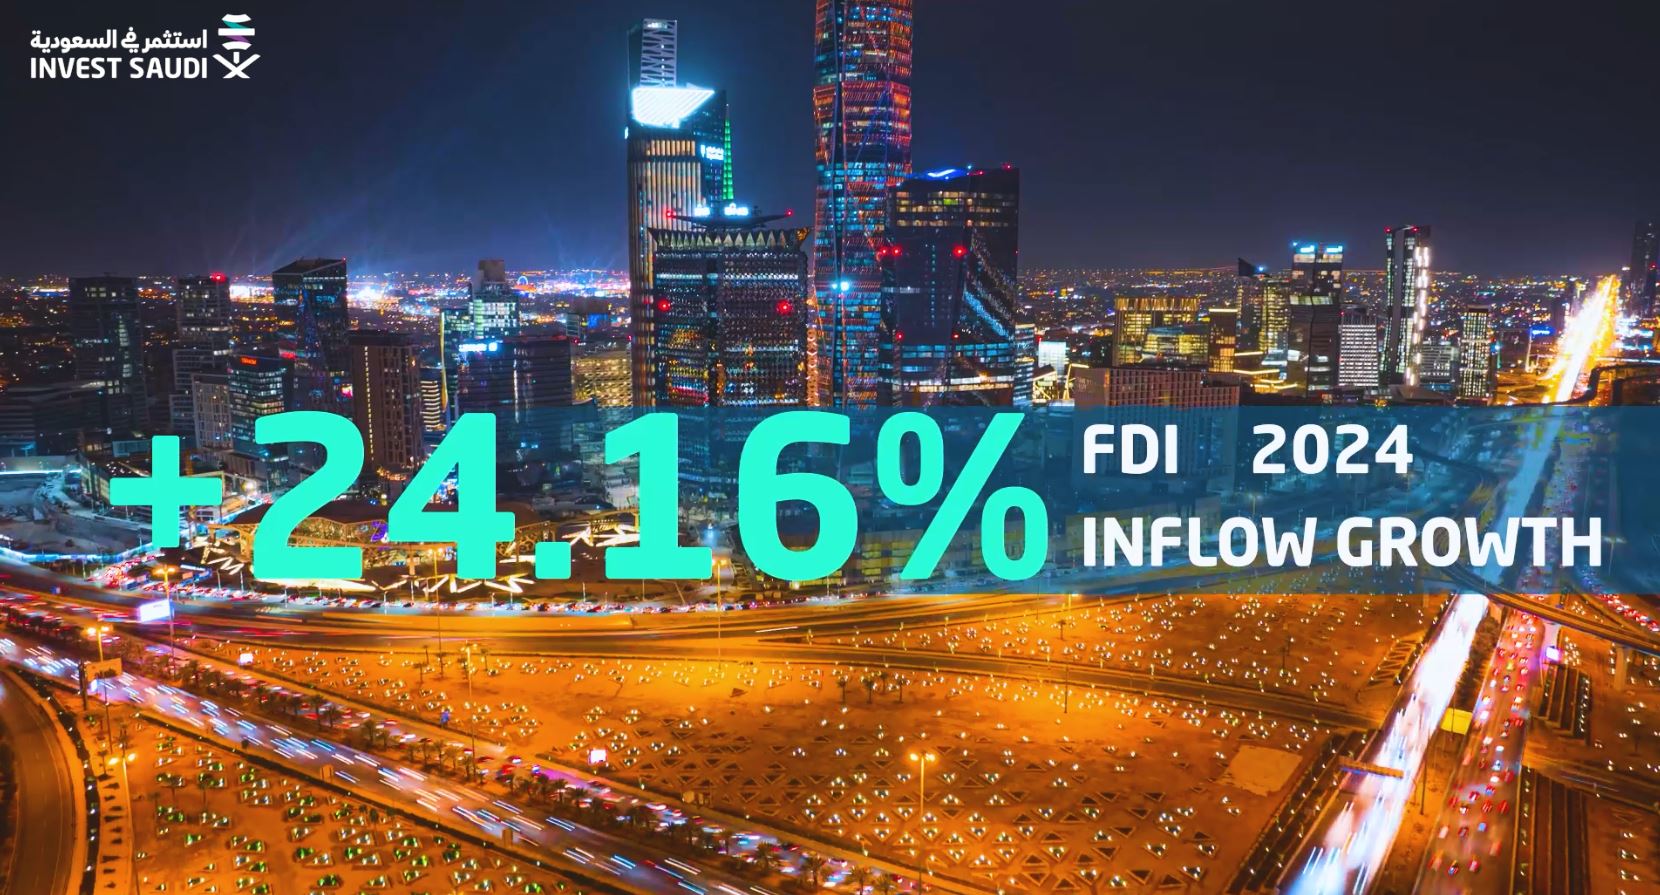
Translating complex economic indicators into clear, engaging motion graphics. An informational video highlighting the Kingdom’s GDP growth and non-oil revenue milestones for Invest Saudi.
00

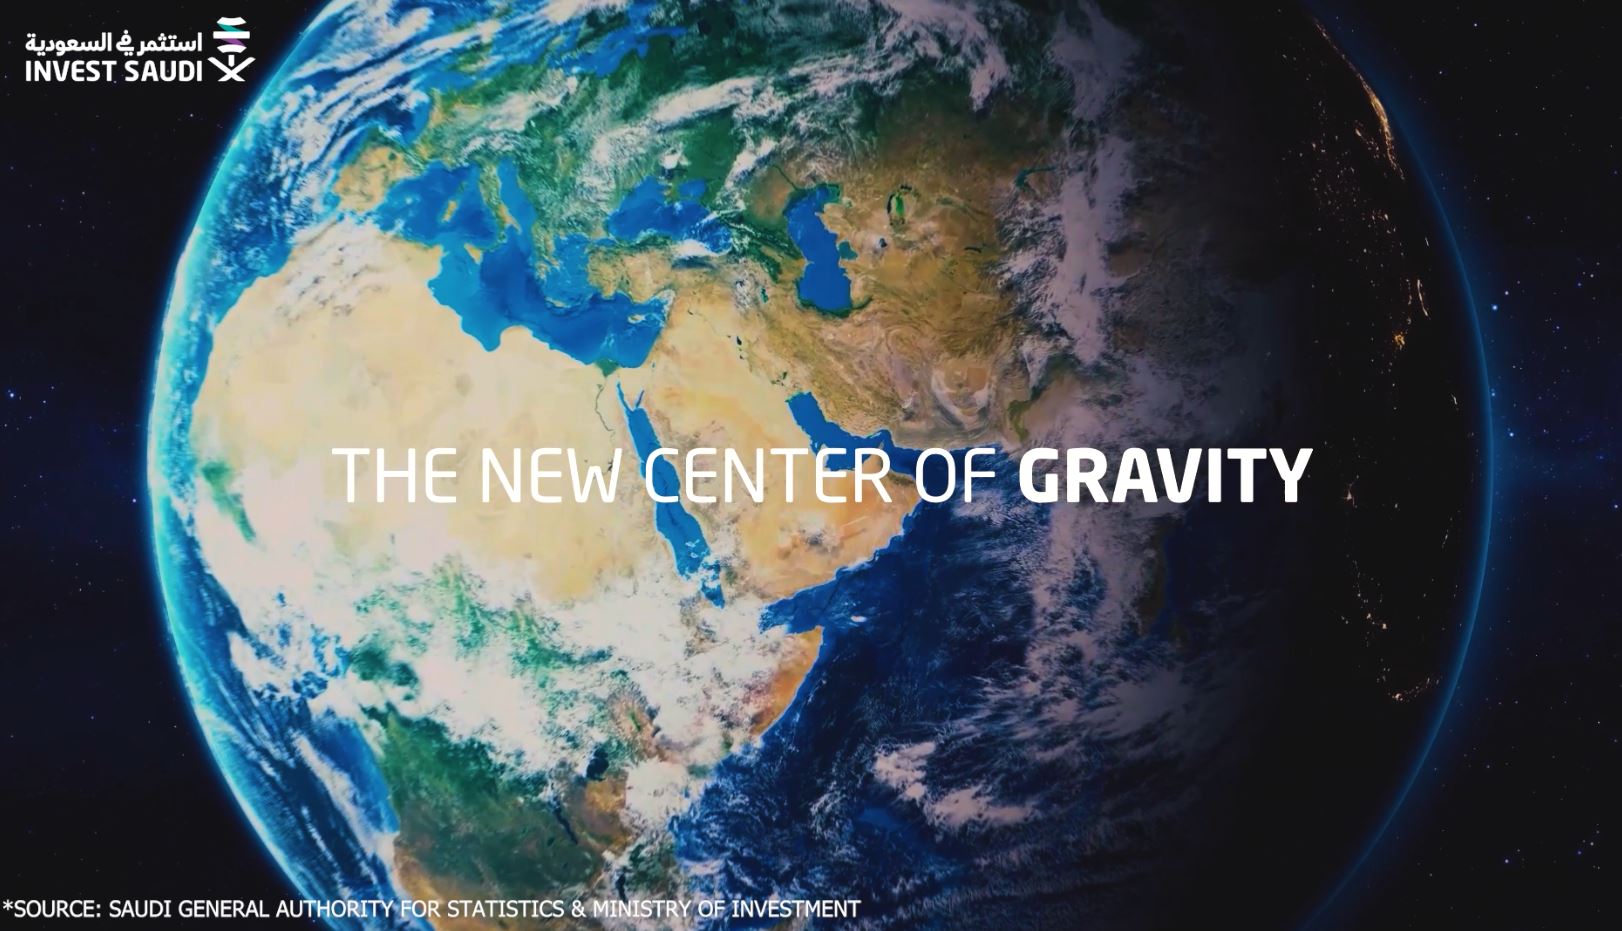
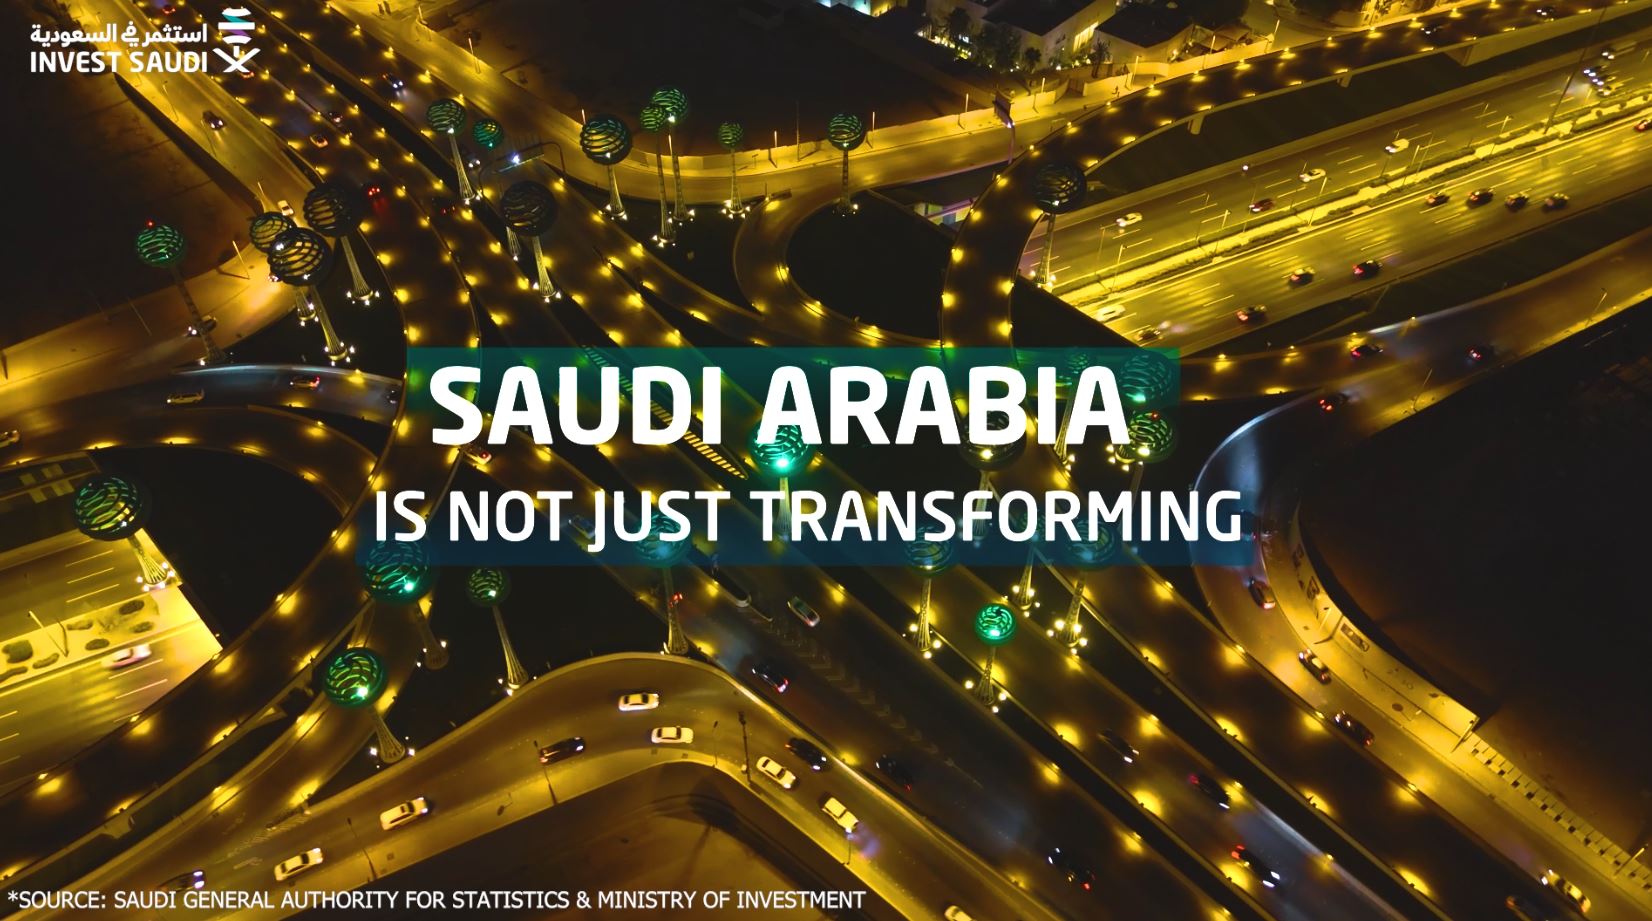
Problem
Invest Saudi needed to communicate positive economic shifts, specifically the rise in non-oil GDP contribution, without boring the audience with static spreadsheets or dense reports. The challenge was to present dry financial statistics in a format that was visually engaging, easy to digest, and strictly aligned with the national investment brand guidelines.
Solution
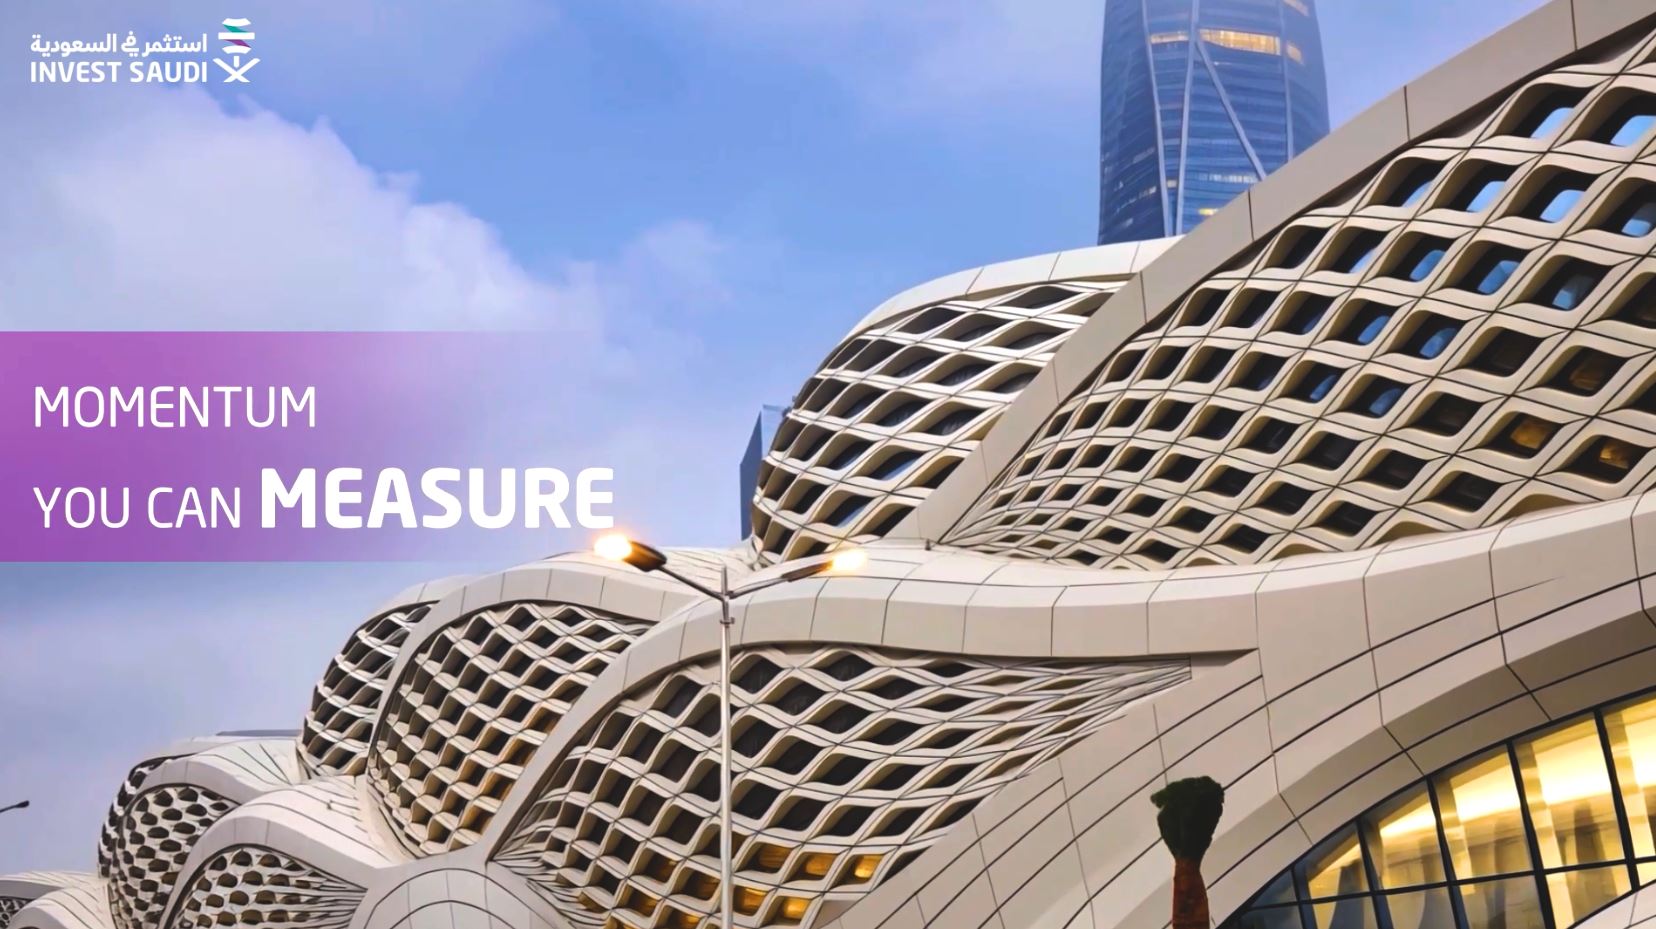
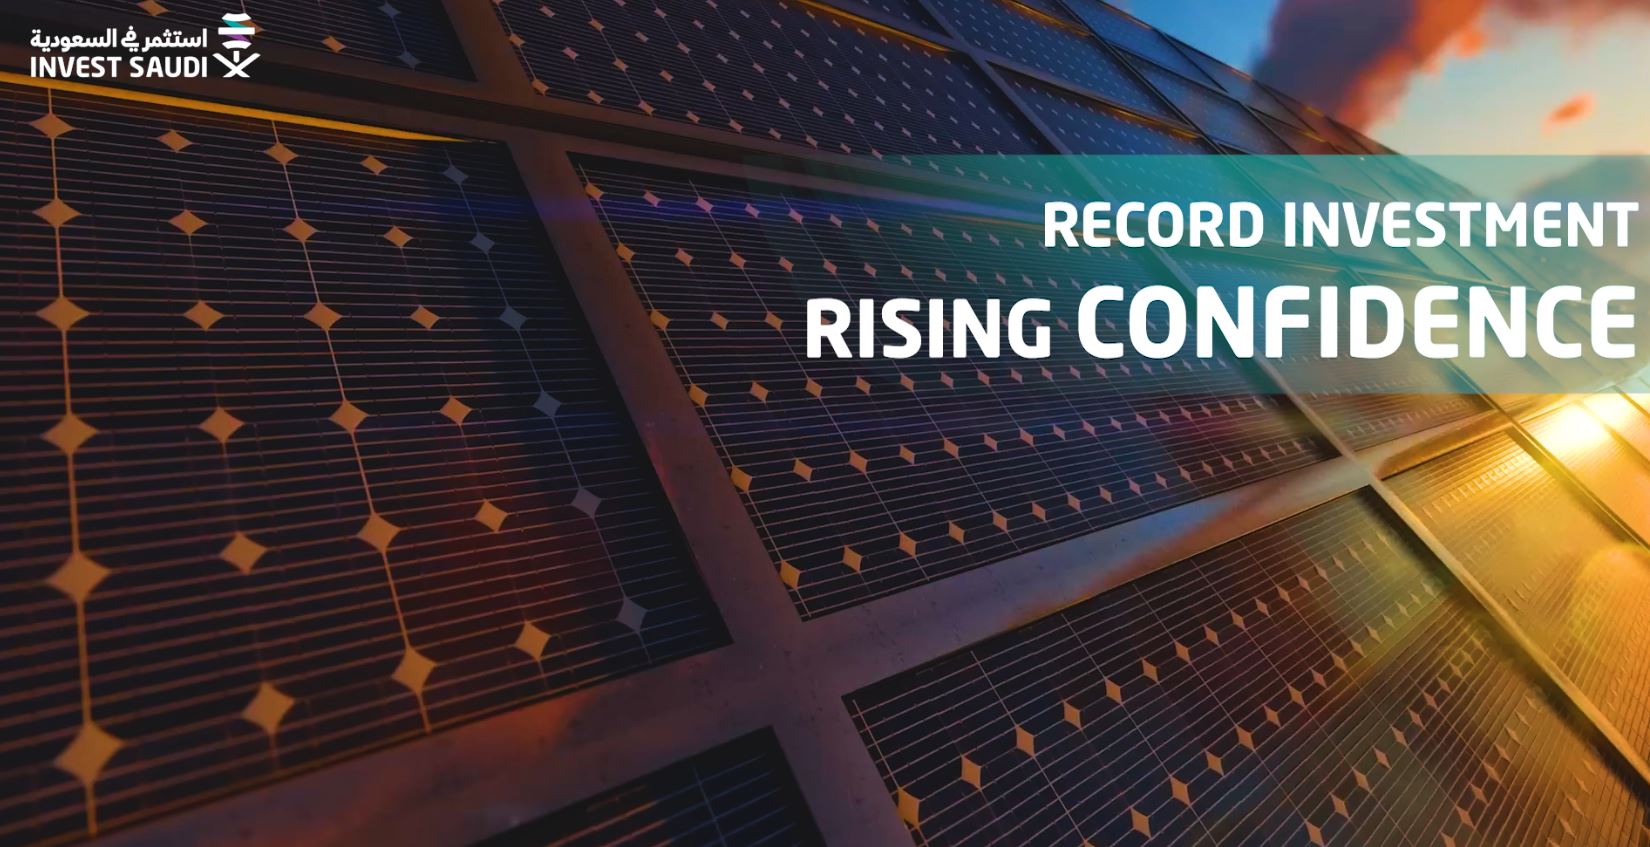
We focused on "Clarity via Motion." We produced a clean, kinetic infographic video that turns raw data into a visual narrative. Using smooth transitions and kinetic typography, we animated key growth metrics, making the statistics pop off the screen while maintaining a professional, corporate tone suitable for international investors.
For this project, the hero was the Data. The objective was to showcase the success of Vision 2030's economic diversification. We stripped away visual noise to focus on the essential metrics: GDP growth and non-oil sector expansion.
By synchronizing the animation timing with the flow of information, we ensured that every percentage point and graph was readable and impactful. This project demonstrates our ability to handle corporate communications where precision and brand consistency are paramount.
01
02
03
04
05
see also


